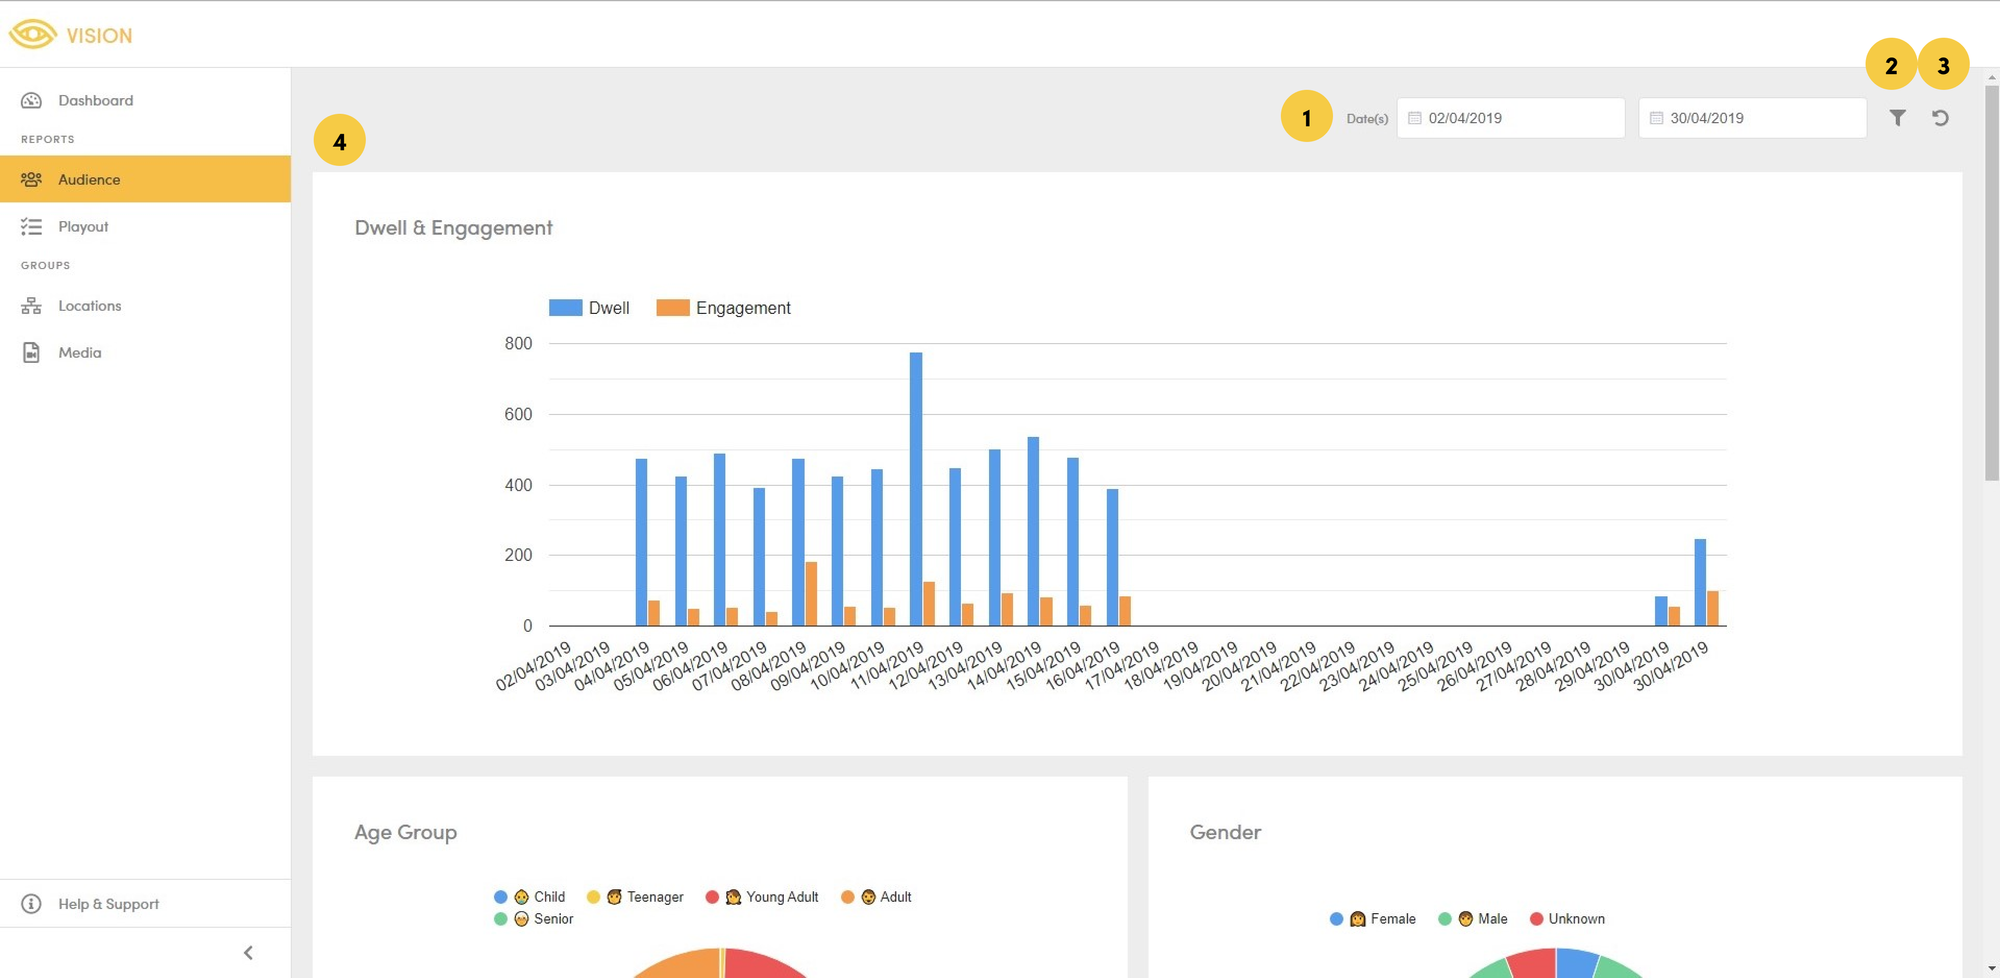
Annotated Acquire Vision Audience interface.
- Time-period: where you select the time period you want to analyse.
- Advanced Filters: addition filters and options to further customise the report.
- Reset: where you reset the time period and advanced filters/options.
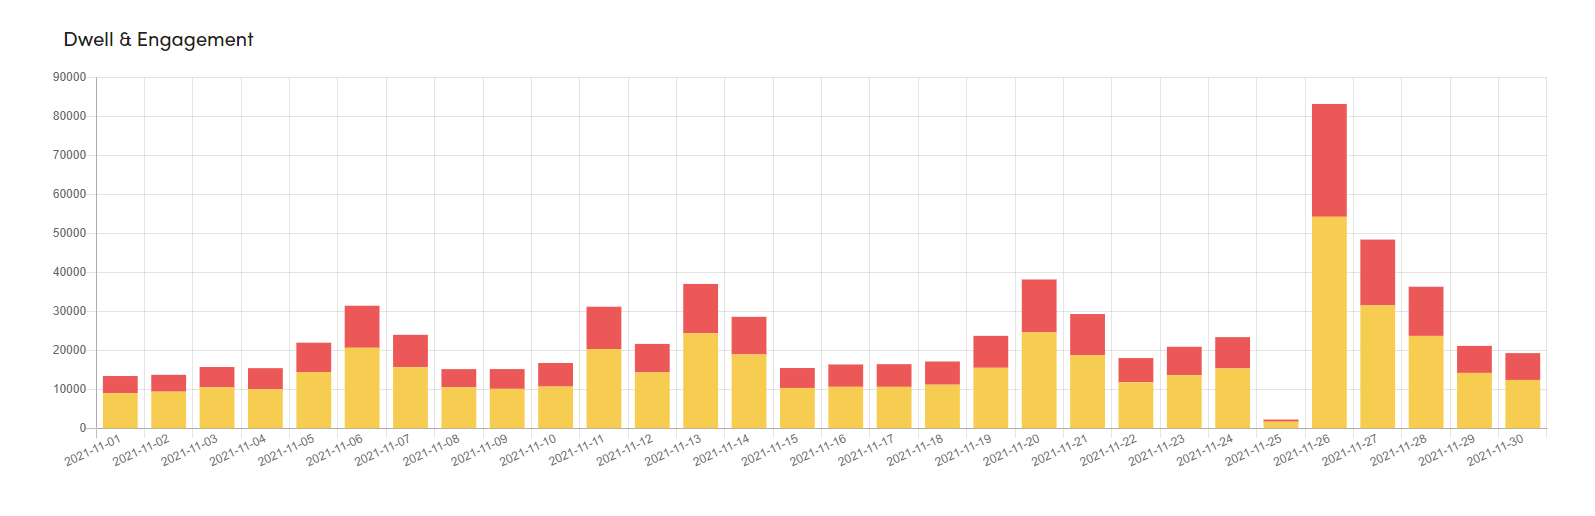
- Demographics: audience demographics including dwell & engagement, Age Groups, Gender, and Emotion.
Dwell
The total amount of time spent in front of the screen, whilst not actively looking at the content.
Engagement
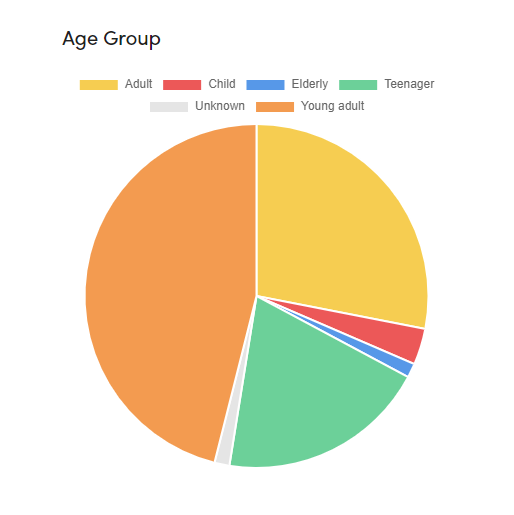
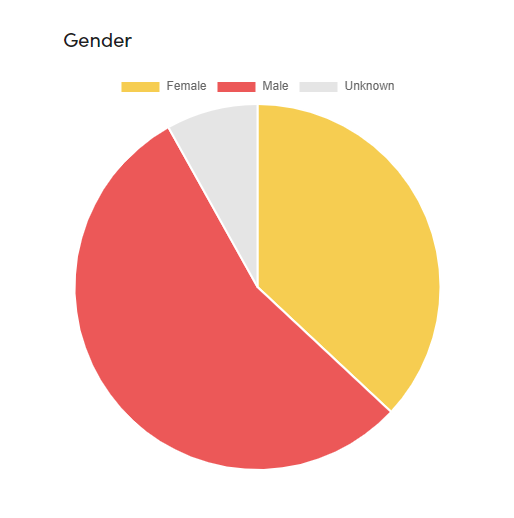
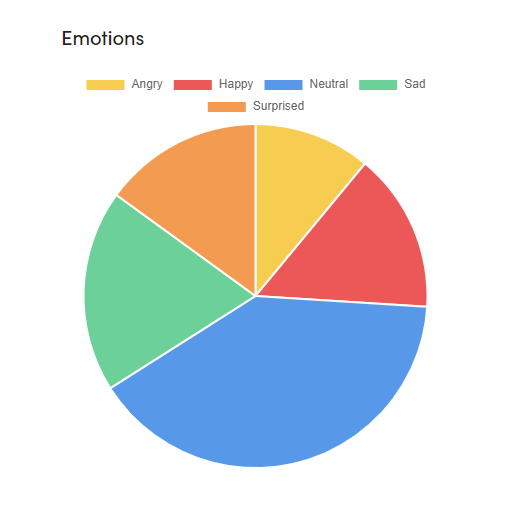
Age Ranges, Gender & Emotion
The total number of visitors split amongst Age groups, Gender and Emotion.